Background of Our Research
DNA damage can be caused by both cell-intrinsic sources, such as reactive oxygen species, and a variety of extrinsic factors, including ultraviolet light, ionizing radiation (IR) and radiomimetic chemicals. If DNA damage is left unrepaired, it may cause cell death and genomic instability, leading to mutation and chromosome rearrangement, and predisposition to cancer. Cell death by DNA damage may cause early aging (Figure 1). Understanding of the mechanisms of DNA damage response is important for the prevention of cancer and cancer therapy.
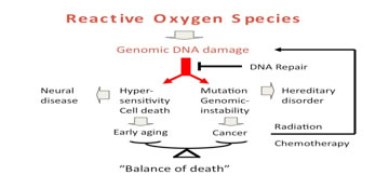
Figure 1
Strategy of Our Research
We want to elucidate the mechanisms of DNA damage repair in living human cells by identifying proteins in real time under microscope and by determining protein complexes at DNA damage site with mass spectrometry. By combining each results of live cell analysis and proteomics, we are able to understand how cells respond to various types of DNA damage and the roles of proteins and protein complexes in DNA damage repair.
Although only several DNA repair pathways are present in human cell, there are several hundreds of proteins involved in cellular resistance to DNA damage (Figure 2), indicating that the mechanisms of damage response within cell are quite complicated. This is partly due to the chromatin structure surrounding DNA, which plays important roles in the repair processes within cell.
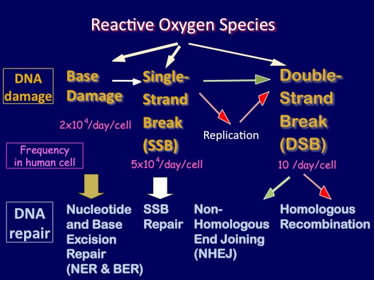
Figure 2
In order to understand how cells respond to DNA damage, we developed various types of cellular micro irradiation system, which enable us to produce various types of DNA damage and visualize proteins accumulating at the site of DNA damage in real time. Since proteins works in general as complexes within cell, we determine protein complexes working at the damage site (Figure 3). We combined the live cell analysis and the proteome analysis, a number of novel proteins and protein complexes have been already identified (see references of our publications). We want to utilize our findings for cancer prevention and cancer therapy.
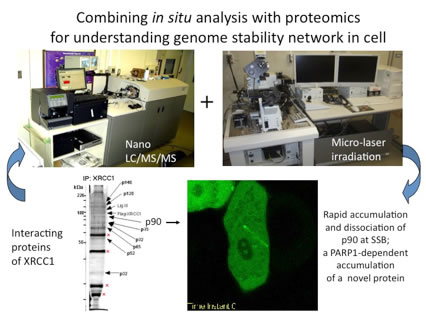
Figure 3